Covid sewage data kept under wraps despite possible public health benefits
Wastewater in five counties in Washington state has carried increased concentrations of Covid-19 in human waste in recent weeks.
Health officials say it’s too soon to know whether the increases in parts of King, Snohomish, Skagit, Clark and Benton counties reflect a new wave of Covid infections, a brief blip or meaningless statistical noise.
According to the Centers for Disease Control and Prevention, concentrations of Covid genetic material at 11 sewage treatment plants in Washington at least doubled from March 28 to April 11, while four plants have seen at least elevenfold increases. Another seven plants had steady or decreasing Covid concentrations.
Some of this public-health data — often touted as an early-warning system for Covid outbreaks – is available publicly at a wastewater tracking site updated daily by the CDC.
But good luck if you want to make sense of it or just find out how much Covid has been flowing through the sewage lines beneath your town.
Much of the potentially life-saving information — from the levels of coronavirus in sewage to the locations being tested — is being kept under wraps.
Sponsored
S
ince everybody poops, wastewater monitoring promises to provide a more inclusive picture of the pandemic than test results from people who swab their noses when they think they might be sick.
“People shed Covid virus in their feces about three to five days before they start having symptoms or would test positive on a regular Covid test,” Washington Department of Health scientist Lauren Jenks said. “So, that could be an early warning sign.”
Tanisha Jain, a University of Washington urban planner and sewer expert, is part of a team studying wastewater in six Seattle neighborhoods, including poorer areas with less access to health care.
Sponsored
“We were successful in observing a rise or fall in Covid signals in wastewater approximately a week before rise and fall in individual testing for covid,” she said.
Nasal swab testing, the usual method of tracking Covid cases, has become less reliable as the pandemic has continued. Eighty percent of the time, the currently dominant omicron variant produces no symptoms, according to University of Washington epidemiologist Ali Mokdad.
He said nasal swab testing catches only seven out of every 100 Covid cases in the United States today.
“When cases start going up, it's all over the media. People go and test themselves,” Mokdad said. “When cases are coming down, people are like, 'Yeah, I'm not going to test myself. I don't have any symptoms.'"
Nasal swabs and wastewater have both showed Covid declining steeply following this winter’s omicron outbreak, by far the worst of the two-year-long pandemic.
Sponsored
Since then, both types of tests have showed more modest increases in some Washington locations.
While wastewater testing can provide a more comprehensive assessment of Covid's spread, Mokdad said the technique has its own drawbacks, especially when it comes to precision.
“Wastewater will tell you how much virus has been shed in a community. It doesn't tell you how many people have been infected,” he said. “It's a shedding factor. Some people shed more than others.”
Researchers say wastewater testing is most useful at spotting the arrival of a new variant or dramatic, order-of-magnitude spikes or declines.
“It can act as a smoke detector," Jain said. "It cannot tell you how big the fire is, but just that there is a fire."
Sponsored
V
irologists have been tracking polio — another viral disease that often spreads silently from people with no symptoms — in wastewater for nearly a century.
Sewage monitoring — or wastewater surveillance, as it’s called — for coronavirus began in Washington state in the first weeks of the pandemic in March 2020. But efforts to track this pandemic through sewage have advanced in fits and starts as understanding of the disease evolved.
Testing at the Seattle area’s main wastewater plants stopped in October 2020 after researchers realized the plants collected waste from such large areas that the signal of the infection spreading was hard to pick out.
Sponsored
“Wastewater data may be useful in the future,” Public Health — Seattle & King County spokesperson Sharon Bogan said by email. “At this time, it's not clear what public health actions would be taken based on signals from wastewater surveillance in the absence of a signal from ‘traditional’ sources.”
The University of Washington team studying six Seattle neighborhoods’ wastewater is still analyzing its results.
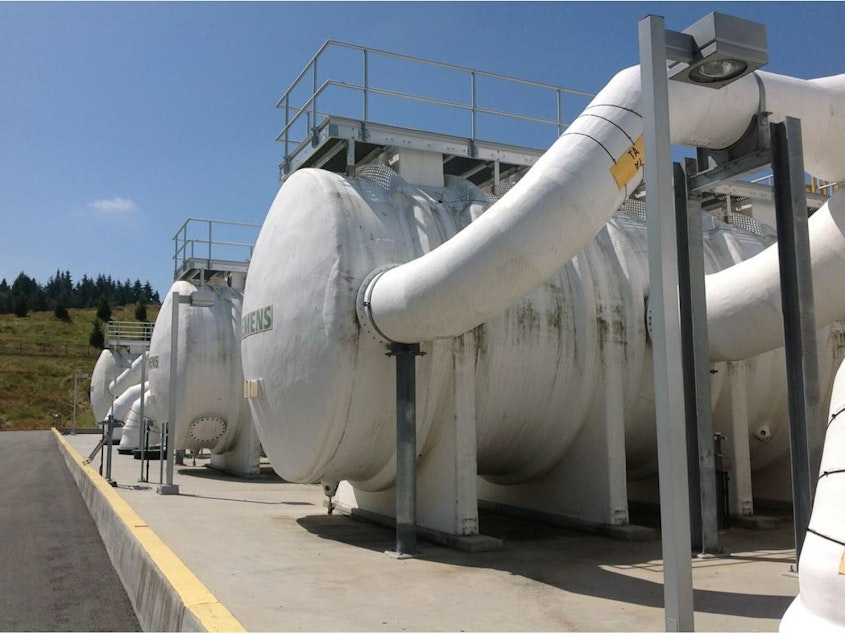
At the Brightwater plant, which handles the waste of 288,000 people in Bothell, Mill Creek, Redmond and Woodinville, testing resumed in February as the winter omicron wave receded.
Then the plant’s Covid concentrations bounced back up, with nearly a 500% increase in the latter half of March alone.
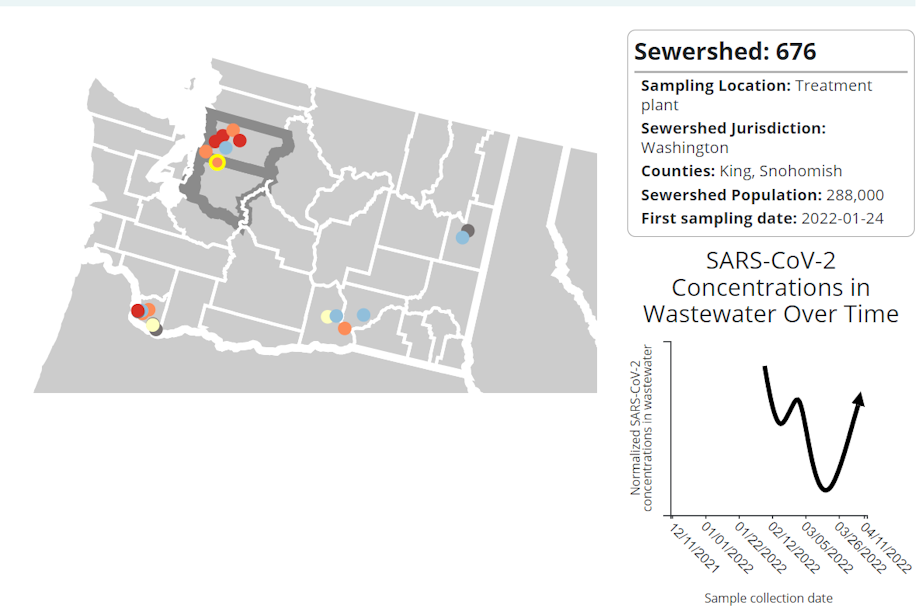
How much that increase matters is unclear. The CDC has stripped the publicly available data of hard numbers. You can’t see how much virus is in the sewage overall, only if it’s gone up or down.
“The percent change is irrelevant without more information,” microbiologist Kent Oostra with Exact Scientific Services in Ferndale said by email.
A 500% increase from a tiny concentration could still yield a very small number.
Oostra said when his firm was testing the town of Lynden’s wastewater for Covid, it provided percentage changes along with an assessment of whether the overall concentration was low, medium or high, the latter suggesting a potential outbreak in the community.
In-person church services and after-school activities in Lynden shut down in 2020 in response to the wastewater studies.
The U.S. Food and Drug Administration is currently testing wastewater for Covid variants in Lynden and Shelton, with the aim of protecting agricultural and seafood workers and the food supply chain. FDA spokespeople in January said they would not have any results before May and in April declined to comment.
“The data they send us doesn’t show numbers either, but the plot graph does show it going down,” said Joe Carter, who manages the Picnic Point wastewater plant in Edmonds. Picnic Point is one of 13 treatment plants invited to test its wastewater by the Washington Department of Health, according to Carter.
“They sent us the bottles, the box, the schedule. They basically do everything,” Carter said. “We’re just trying to help where we can.”
Currently, sewage in two dozen locations around Washington state is being monitored for the virus and its variants. Few of those results are publicly available.
Instead of naming the participating treatment plants, the CDC has assigned each one a code number. It has also shifted their locations slightly on its maps to avoid revealing their identities.
“Some utilities consider location information of facilities and equipment to be secure information,” CDC spokesperson Brian Katzowitz said by email.
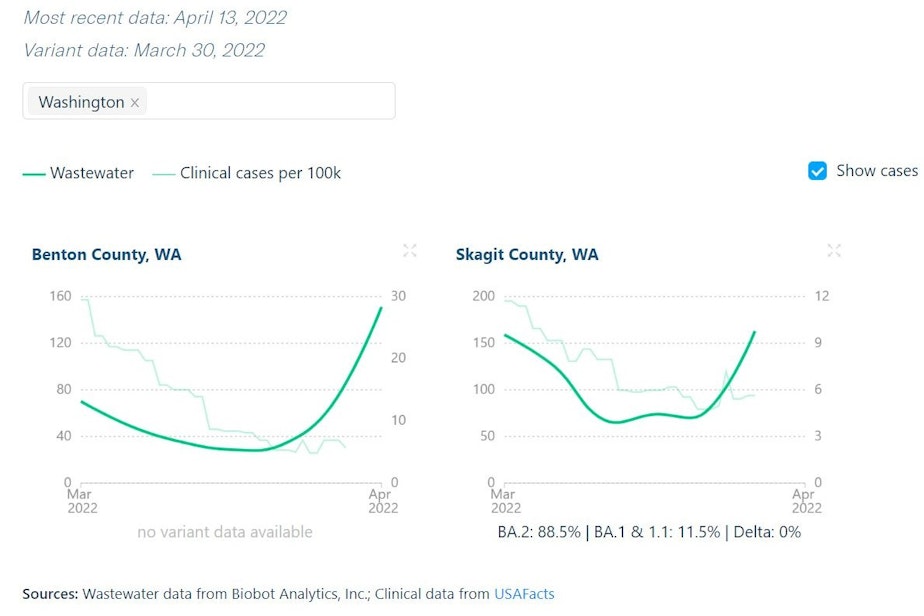
The Massachusetts company Biobot is conducting wastewater testing in Benton and Skagit counties.
Biobot scientist Nour Sharara said the company does not release information below the county level.
In response to a KUOW request, the Washington Department of Health provided a key to the treatment plant identities concealed by the CDC.
With this key, included below, users of the CDC’s wastewater tracker still can’t tell whether Covid concentrations in wastewater are high or low, but they can at least learn which treatment plants have seen large increases in those concentrations.
-
John Ryan

Environment Reporter
John Ryan joined KUOW as its first full-time investigative reporter in 2009 and became its environment reporter in 2018. He focuses on climate change, energy, and the ecosystems of the Puget Sound region.
More stories from John Ryan »


